Microsoft Excel is a powerful tool for managing data and improving productivity. Many users only scratch the surface of its capabilities. Learning advanced Excel techniques can transform your workflow and save hours of time.
Excel offers features that go far beyond basic data entry and simple calculations. From automating repetitive tasks to creating dynamic reports, Excel has tools for every level of user. Flash Fill, AutoSum, and Freeze Top Row are just a few features that can speed up your work.
For those new to Excel, mastering keyboard shortcuts is a great starting point. More advanced users can explore functions like VLOOKUP or pivot tables to analyze complex datasets. With practice, anyone can become an Excel pro and boost their efficiency at work.
Unleashing the Power of Excel: Tools, Tips, and Advanced Functions
Microsoft Excel is more than just a spreadsheet program. It’s a powerful tool that can help you analyze data, automate tasks, and make informed decisions. Whether you’re a beginner or an experienced user, there’s always something new to discover in Excel. This guide will explore some essential tools, helpful tips, and advanced functions to elevate your Excel skills.
Essential Tools: Beyond the Basics
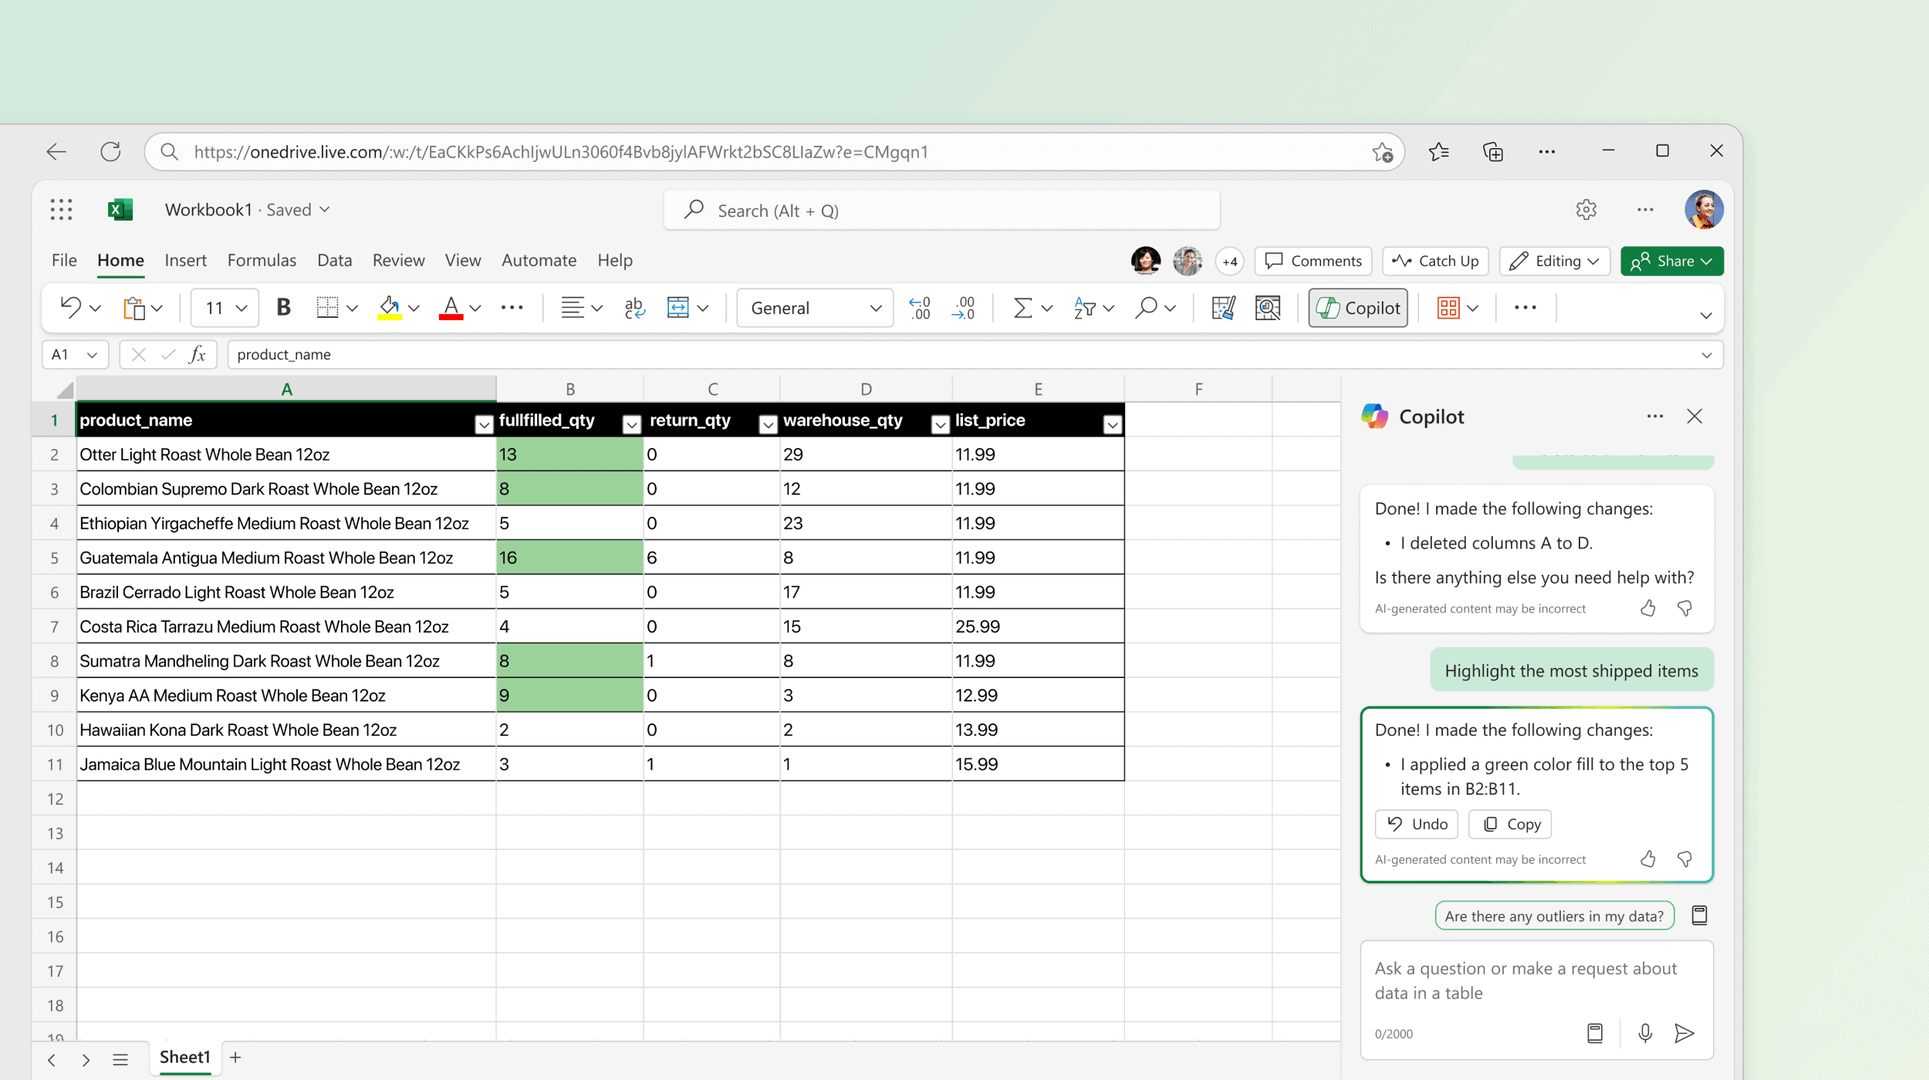
While you might be familiar with basic functions like SUM and AVERAGE, Excel offers a vast array of tools to streamline your work. “Flash Fill” automatically recognizes patterns and fills in data for you, saving you time and effort. “Conditional Formatting” highlights cells based on specific rules, making it easy to identify trends or outliers. “Data Validation” ensures data accuracy by restricting input to specific values or formats.
Data Analysis Made Easy: PivotTables and Charts
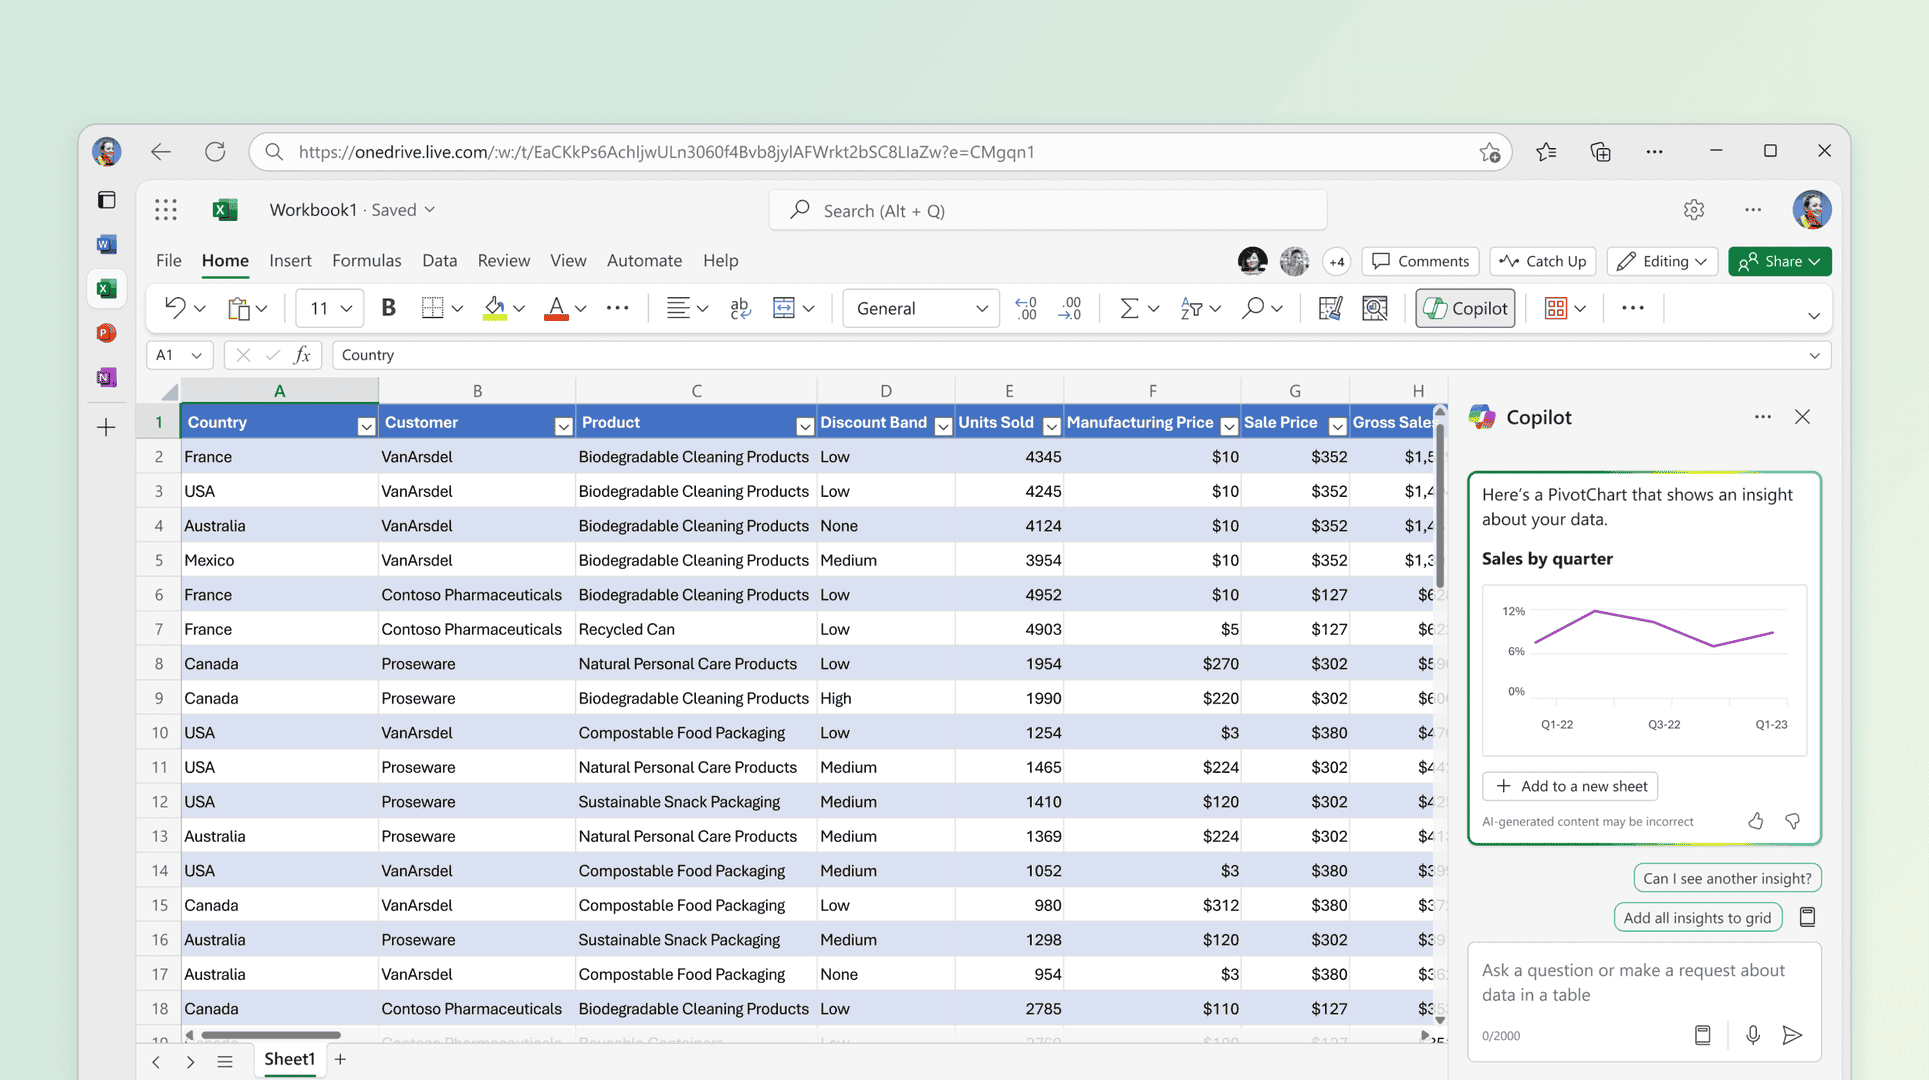
PivotTables are a game-changer for summarizing and analyzing large datasets. They allow you to quickly group, filter, and aggregate data to gain valuable insights. Complement your PivotTables with charts to visualize trends and patterns. Excel offers a variety of chart types, from basic bar charts to interactive maps, to effectively communicate your data.
Advanced Functions: Unlocking Deeper Insights
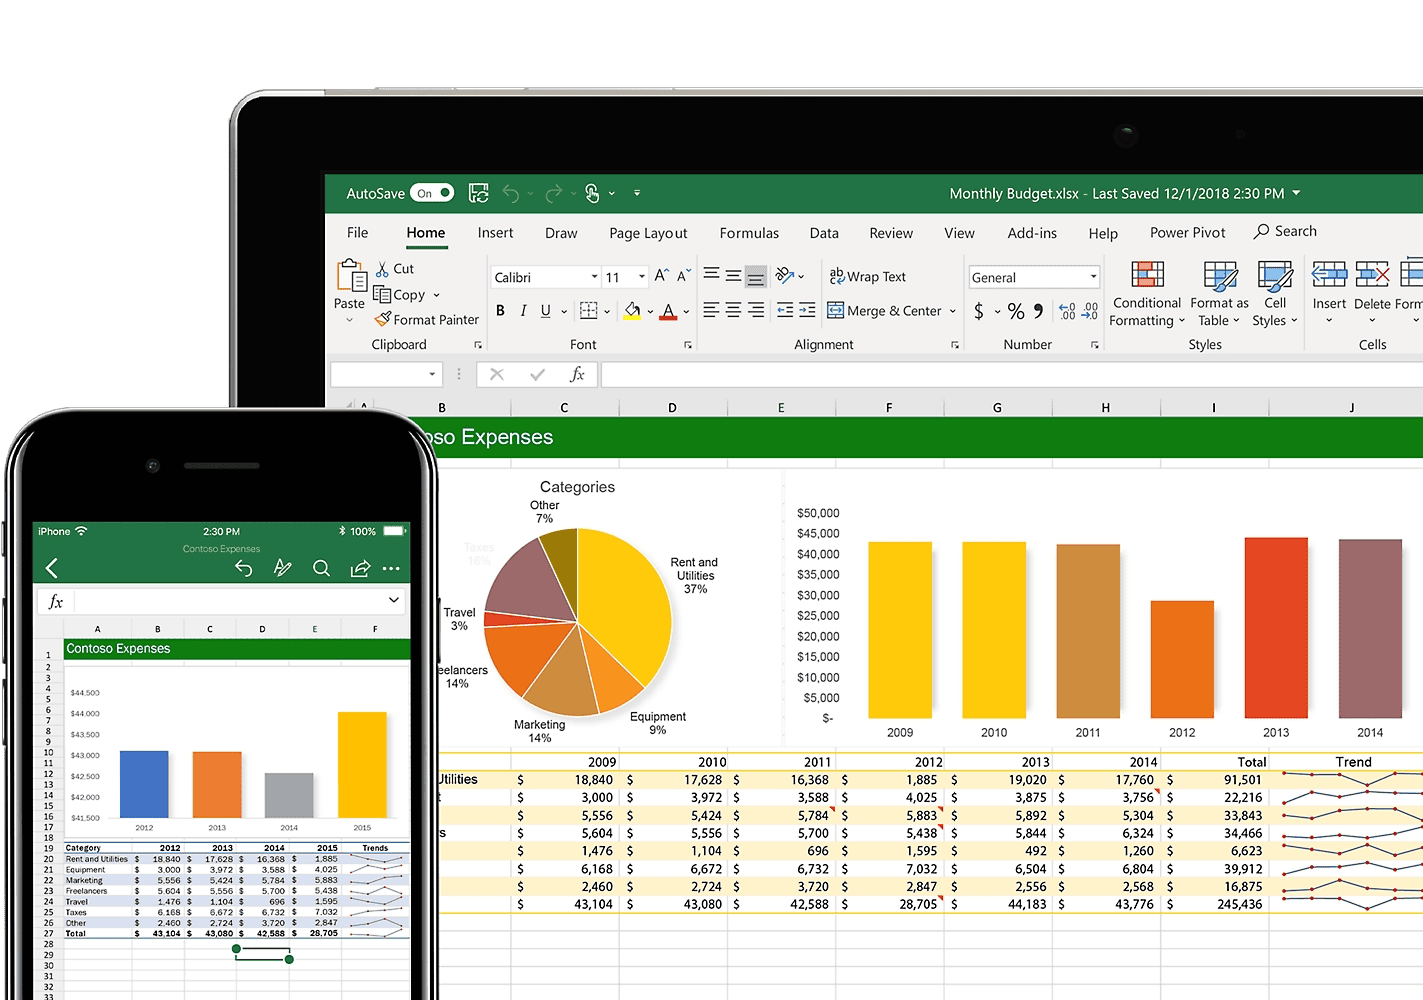
Excel boasts a library of advanced functions to perform complex calculations and analysis. “VLOOKUP” and “INDEX-MATCH” help you find and retrieve specific data from large tables. “IF” statements allow you to create conditional logic within your spreadsheets. “SUMIFS” and “COUNTIFS” enable you to sum or count values based on multiple criteria.
Time-Saving Tips: Boosting Your Efficiency
Here are a few tips to streamline your Excel workflow:
- Keyboard shortcuts: Master essential shortcuts like “Ctrl + C” (copy), “Ctrl + V” (paste), and “Ctrl + Z” (undo) to navigate and edit your spreadsheets quickly.
- Custom views: Create custom views to save specific display settings, filters, and selections for quick access to different perspectives of your data.
- Templates: Utilize Excel’s built-in templates or create your own to save time and ensure consistency for frequently used spreadsheet layouts.
- Data validation: Prevent errors and ensure data accuracy by using data validation to restrict input to specific values or formats.
Hidden Gems: Unveiling Excel’s Power
Excel has a few lesser-known features that can significantly enhance your productivity:
- Goal Seek: This tool helps you find the input value needed to achieve a desired output, making it useful for “what-if” analysis and scenario planning.
- Solver: For more complex optimization problems, Solver can find the optimal values for multiple variables to maximize or minimize a specific outcome.
- Power Query: Import and transform data from various sources, including web pages and databases, with Power Query’s intuitive interface.
- Macros and VBA: Automate repetitive tasks and create custom functions with Excel’s macro recorder and Visual Basic for Applications (VBA) programming language.
Essential Keyboard Shortcuts for Excel
| Action | Shortcut |
|---|---|
| Copy selected cells | Ctrl + C |
| Paste copied cells | Ctrl + V |
| Undo last action | Ctrl + Z |
| Select entire row | Shift + Spacebar |
| Select entire column | Ctrl + Spacebar |
| Go to cell A1 | Ctrl + Home |
Working with Data: Calculations and Analysis
Excel provides a wide range of functions for data manipulation and analysis:
- Calculating sample mean: Use the
AVERAGEfunction to calculate the average of a sample of data. - Calculating years of service/tenure: Use the
YEARFRACfunction to calculate the difference between two dates in years. - Converting currency: Use the
CONVERTfunction to convert between different currencies. - Calculating age: Use the
YEARFRACfunction with the person’s birthdate andTODAY()function. - Annualized return: Use the formula
((Ending Value - Beginning Value) / Beginning Value) / (Number of Years) - Arranging numbers in ascending order: Use the
SORTfunction. - Finding p-value: Use the
T.TESTfunction for t-tests orCHISQ.TESTfor chi-squared tests. - Calculating MAD (Mean Absolute Deviation): Use the
AVEDEVfunction. - Counting unique values in a pivot table: Use the “Count Unique Values” option in the PivotTable field settings.
- Calculating expected value: Use the
SUMPRODUCTfunction to multiply probabilities by their corresponding values and sum the results. - Calculating years between dates: Use the
YEARFRACfunction or subtract the earlier date from the later date. - Combining first and last name: Use the
CONCATENATEfunction or the ampersand operator (&). - Comparing two columns: Use conditional formatting to highlight differences or the
EXACTfunction to check for exact matches. - Calculating weighted average: Use the
SUMPRODUCTfunction to multiply values by their weights and divide by the sum of the weights. - Finding relative frequency: Divide the frequency of a specific value by the total number of values.
- Calculating difference between two numbers: Simply subtract one number from the other.
- Extracting month from date: Use the
MONTHfunction. - Multiplication function: Use the asterisk operator (*) to multiply numbers.
- Calculating business days: Use the
NETWORKDAYSfunction. - Absolute value: Use the
ABSfunction. - Changing number to negative: Multiply the number by -1.
- Counting cells with text: Use the
COUNTAfunction. - Finding critical value: Use the
T.INVfunction for t-distributions orNORM.S.INVfor normal distributions. - Calculating confidence interval: Use the
CONFIDENCEfunction. - Calculating WACC (Weighted Average Cost of Capital): Use the formula
(E/V * Re) + ((D/V * Rd) * (1 - Tc))where E = market value of equity, D = market value of debt, V = total value of capital (E + D), Re = cost of equity, Rd = cost of debt, and Tc = corporate tax rate. - Calculating Sharpe Ratio: Use the formula
(Rp - Rf) / σpwhere Rp = portfolio return, Rf = risk-free rate, and σp = standard deviation of portfolio return. - Calculating probability: Divide the number of favorable outcomes by the total number of possible outcomes.
- Formula to count characters in a cell: Use the
LENfunction. - Finding range: Subtract the minimum value from the maximum value.
Formatting and Layout
Enhance the appearance and organization of your spreadsheets:
- Horizontal centering: To center content horizontally across multiple columns, select the cells and use the “Merge & Center” option in the “Alignment” group on the “Home” tab.
- Merging columns: Select the columns you want to merge, right-click, and choose “Merge Cells.”
- Merging rows: Select the rows you want to merge, right-click, and choose “Merge Cells.”
- Creating space in a cell: Use the “Wrap Text” option in the “Alignment” group on the “Home” tab to wrap text within a cell or insert line breaks (Alt + Enter) to create space.
- Making cells expand to fit text vertically: Double-click the bottom border of the row header to automatically adjust the row height to fit the text.
- Hiding all notes: Go to the “Review” tab and click “Show All Comments” to toggle them off.
- Hiding filter buttons: Click the “Filter” button again to hide the filter buttons.
- Inserting a footnote: Go to the “References” tab and click “Insert Footnote.”
- Creating a drop-down list with multiple selections: Use the “Data Validation” feature with the “Allow” setting as “List” and check the “Multi-select” option.
- Grouping worksheets: Select the worksheets you want to group by holding down the Ctrl key and clicking on the sheet tabs.
- Merging and centering: Select the cells and use the “Merge & Center” option in the “Alignment” group on the “Home” tab.
- Adding quotes around text: Use the
CHAR(34)function to add quotes within a formula. - Capitalizing all: Use the
UPPERfunction. - Hiding all notes: Go to the “Review” tab and click “Notes > Hide All Notes.”
- Changing theme colors: Go to the “Page Layout” tab and click “Colors” to choose a different theme.
Other Useful Tips and Features
Here are some additional tips and features to enhance your Excel experience:
- Keyboard shortcut to cut a cell value: Ctrl + X
- Clearing Excel cache: Go to “File > Options > Advanced” and click “Clear File Cache.”
- Force quitting Excel: Press Ctrl + Shift + Esc to open the Task Manager, select Excel, and click “End Task.”
- Opening Excel in safe mode: Hold down the Ctrl key while starting Excel.
- Dark mode: Enable dark mode in your operating system settings, and Excel will automatically switch to a dark theme.
- Copying only visible cells: Filter the data, select the visible cells, and use the “Go To Special” dialog box (Ctrl + G) to copy only the visible cells.
- Collapsing columns: Outline the data and use the outline symbols to collapse columns.
- Copying horizontal and pasting vertical: Use the “Transpose” option in the “Paste Special” dialog box.
- Creating a table with multiple columns: Select the data range and go to the “Insert” tab and click “Table.”
- Closing a dialog box: Press the Esc key.
- Inserting a clustered column pivot chart: Create a pivot table, then go to the “Insert” tab and choose “PivotChart.”
- Creating an Excel dashboard: Use various charts, graphs, and interactive elements to create a visual representation of your data.
- Creating a yes/no checkbox: Insert a checkbox from the “Developer” tab. If the “Developer” tab is not visible, go to “File > Options > Customize Ribbon” and check the “Developer” box.
- Grouping worksheets: Select the worksheets you want to group by holding down the Ctrl key and clicking on the sheet tabs.
- Deleting multiple tabs: Select the tabs you want to delete by holding down the Ctrl key and clicking on the sheet tabs, then right-click and choose “Delete.”
- Accessing the VBA editor: Enable the “Developer” tab (see instructions above), then click “Visual Basic” to open the VBA editor.
- Calculating yield to maturity: Use the
YIELDfunction. - Excel
DAYof week from date: Use theWEEKDAYfunction. - Normalizing data: Subtract the minimum value and divide by the range (maximum value – minimum value).
- Downloading Excel on Mac: Visit the Microsoft website or the Mac App Store to download Excel.
- Ignoring formula if cell is blank: Use the
IFfunction to check if the cell is blank before applying the formula.
By mastering these tools, tips, and advanced functions, you can unlock the full potential of Excel and become a spreadsheet power user!
Key Takeaways
- Excel offers powerful features for data management and analysis
- Learning advanced techniques can significantly improve productivity
- Regular practice with Excel tools leads to mastery and efficiency gains
Mastering Data Management and Analysis
Excel offers powerful tools for managing and analyzing data. These features help users work efficiently and gain valuable insights from their information.
Understanding Excel Formulas and Functions
Excel formulas are key to data analysis. They perform calculations on cell values. Basic formulas use simple math operators like +, -, *, and /. More complex formulas use functions.
Functions are pre-made formulas. They speed up common tasks. Some popular functions include:
- SUM: Adds up a range of numbers
- AVERAGE: Calculates the mean of a set of values
- COUNT: Counts the number of cells with numbers
- IF: Performs logical tests on data
To use a function, type an equals sign (=) followed by the function name. Then add arguments in parentheses. For example: =SUM(A1) adds all values in cells A1 through A10.
Named ranges can make formulas easier to read. They let you use text labels instead of cell references.
Data Entry Techniques and Efficiency
Fast data entry boosts productivity. Here are some tips to speed up your work:
- Use keyboard shortcuts
- Fill cells quickly with AutoFill
- Enter data in multiple cells at once
The Find and Replace tool helps fix errors in large datasets. It can change many cells at once.
For repetitive tasks, create custom shortcuts. These can save time on common actions.
Data validation prevents errors. It sets rules for what can be entered in a cell. This keeps your data clean and accurate.
Data Sorting, Filtering, and Conditional Formatting
Sorting arranges data in a specific order. You can sort by text, numbers, or dates. This helps spot patterns and organize information.
Filtering shows only the data you want to see. It hides rows that don’t meet your criteria. This is useful for large datasets.
Conditional formatting changes how cells look based on their values. It can:
- Highlight cells above or below a certain value
- Show trends with color scales
- Use icon sets to rate data
These tools make it easy to spot outliers and trends. They turn raw numbers into visual insights.
Removing duplicates keeps data clean. Excel can find and delete repeat entries with a few clicks.
Slicers offer an easy way to filter data. They work well with tables and pivot tables. Users can click buttons to show only the data they need.
Enhancing Productivity with Advanced Excel Features
Excel offers powerful tools to boost efficiency and streamline workflows. These features help users save time and create impactful data presentations.
Time-Saving Tools and Excel Shortcuts
Excel shortcuts speed up common tasks. Ctrl + Arrow keys move quickly between data regions. Ctrl + Shift + Arrow keys select entire ranges. Alt + = auto-sums selected cells.
Flash Fill automatically fills data based on patterns. Users type the first entry and Excel predicts the rest.
The Fill Handle copies formulas or extends series. Drag the small square in the cell’s corner to apply it to other cells.
Drop-down lists limit data entry options. This reduces errors and speeds up input. Users can create them through Data Validation.
Freeze Panes keeps headers visible while scrolling. This helps when working with large datasets.
Creating and Manipulating Visual Data with Excel
Charts and graphs turn numbers into visual insights. Excel offers many chart types to fit different data needs.
Pivot Tables summarize large datasets quickly. They allow users to rearrange data views without changing the source.
Sparklines create mini-charts within single cells. They show trends in a compact space.
Excel Tables organize data with built-in sorting and filtering. They automatically expand when new data is added.
Conditional Formatting highlights important information visually. It changes cell appearance based on set rules.
Automating Tasks with Excel VBA and Macros
VBA (Visual Basic for Applications) automates repetitive tasks. Users can record macros to repeat complex actions with a single click.
Custom functions extend Excel’s capabilities. They perform calculations not available in standard formulas.
Add-ins expand Excel’s features. They add new tools and functions to the program.
Power Query imports and cleans data from various sources. It can combine data from multiple files or databases.
Text to Columns splits data in one cell into multiple columns. This is useful for organizing imported data.
Frequently Asked Questions
Excel offers many features to boost productivity and efficiency. Users can learn essential formulas, shortcuts, and functions to enhance their skills.
What are some advanced tips to increase proficiency in Microsoft Excel?
AutoSum is a powerful tool for quick calculations. Users can select a cell below numbers they want to add and click AutoSum on the Home tab.
Excel’s Freeze Panes feature helps keep important data visible while scrolling. To use it, select the cell below and to the right of the area to freeze, then click View > Freeze Panes.
Can you list essential Excel formulas that every user should know?
Basic formulas include SUM, AVERAGE, COUNT, and IF. These help with common tasks like adding numbers, finding averages, and making decisions based on data.
More advanced formulas are VLOOKUP, INDEX/MATCH, and SUMIF. These allow users to search for data, combine information from different sheets, and add numbers that meet specific criteria.
How can one improve their skills in Microsoft Excel?
Regular practice is key to improving Excel skills. Users can work on sample datasets or create their own projects to apply new techniques.
Online resources offer many Excel tips and tricks. These can help users learn new functions and shortcuts to optimize their workflow.
What are the basic functions of Excel that a beginner should learn?
Beginners should start with data entry, formatting, and basic calculations. Learning to create simple charts and tables is also important.
Understanding how to sort and filter data helps organize information effectively. This skill is crucial for working with large datasets.
Which shortcuts and functions are crucial for speeding up work in Excel?
Ctrl + C (copy), Ctrl + V (paste), and Ctrl + Z (undo) are essential shortcuts for quick data manipulation. F2 allows users to edit cell contents quickly.
The Fill Handle is a time-saving tool. It can auto-fill series or copy formulas down a column with just a drag.
Where can I find a comprehensive cheat sheet for Excel tips and tricks?
Microsoft’s official support website offers a comprehensive guide to Excel tips and tricks. It covers various topics from basic functions to advanced features.
Many Excel-focused websites provide downloadable cheat sheets. These often include keyboard shortcuts, common formulas, and time-saving techniques.
What is Microsoft Excel do?
Microsoft Excel is a spreadsheet program used to organize, analyze, and store data. It allows you to perform calculations, create charts and graphs, and automate tasks. Excel is widely used in various fields, from business and finance to education and research, for tasks such as budgeting, data analysis, and record-keeping.
What are the 5 basic functions of Excel?
While Excel offers hundreds of functions, five basic ones are essential for beginners:
- SUM: Adds a range of numbers.
- AVERAGE: Calculates the average of a range of numbers.
- COUNT: Counts the number of cells that contain numbers.
- MAX: Finds the highest value in a range.
- MIN: Finds the lowest value in a range.
Is Microsoft Excel free to use?
Microsoft Excel is not entirely free. It is part of the Microsoft Office suite, which requires a purchase or subscription. However, there are a few ways to use Excel for free:
- Excel Online: A free web-based version of Excel with limited features.
- Mobile App: Free Excel apps for iOS and Android devices with basic functionalities.
- Trial Version: Microsoft offers a free trial of Microsoft 365, which includes Excel.
What is Excel for beginners?
For beginners, Excel is a tool to organize data in rows and columns. You can use it to create simple budgets, track expenses, or make lists. Start by learning basic functions like SUM, AVERAGE, and COUNT. Familiarize yourself with formatting options to make your spreadsheets look presentable. As you gain confidence, explore more advanced features like charts, formulas, and data analysis tools.
Can I teach myself Excel?
Absolutely! Many resources are available to help you learn Excel at your own pace. Online tutorials, video courses, and interactive exercises can guide you through the basics and beyond. Microsoft also offers support documentation and templates within Excel. Start with the essentials and gradually explore more advanced features as you become comfortable. Practice regularly to reinforce your learning and build your Excel skills.

