Visualizing IoT data with a web app can transform how businesses understand and interact with their connected devices. By using real-time sensor data, telemetry, and interactive dashboards, companies can gain clear insights quickly. This blog explains how to set up and use web applications for effective IoT data visualization.
To start, setting up the IoT data pipeline involves preparing your IoT hub, integrating consumer groups, and deploying your web app. These steps allow seamless access and display of data from various IoT devices. Web apps provide an intuitive way to view and analyze the data.
A practical example includes creating an IoT dashboard which centralizes all important metrics on one screen. Dashboards present data in an easy-to-digest format, helping users monitor device performance, spot issues, and make informed decisions efficiently.
Unveiling Insights: Visualizing IoT Data through Web Applications
IoT (Internet of Things) devices are generating vast amounts of data. Making sense of this data is crucial for extracting actionable insights and making informed decisions. Web applications offer an ideal platform for visualizing IoT data, making it easier to understand trends, patterns, and anomalies in real time.
Why Visualize IoT Data?
Visualizations help transform raw data into meaningful representations. Graphs, charts, and dashboards provide a clear, concise view of complex datasets. By presenting information visually, web applications simplify data analysis, allowing users to quickly identify key trends, spot anomalies, and monitor performance.
Key Components of IoT Data Visualization Web Apps
| Component | Description | Importance |
|---|---|---|
| Data Collection: | The process of gathering data from IoT devices. | Ensures accurate and relevant data for visualization. |
| Data Processing: | Transforming raw data into usable formats for analysis. | Prepares data for visualization tools. |
| Data Storage: | Storing processed data for future reference and analysis. | Enables historical data comparisons and trend identification. |
| Visualization Tools: | Libraries and frameworks for creating charts, graphs, and dashboards. | Presents data in an easily understandable format. |
| User Interface (UI): | The front-end of the web app, where users interact with the visualizations. | Provides a user-friendly experience for exploring data. |
| Backend: | Handles data retrieval, processing, and interaction with the UI. | Powers the functionality of the web application. |
Popular Technologies for Building IoT Data Visualization Web Apps
- Frontend: HTML, CSS, JavaScript (with libraries like React, Vue, or Angular), Chart.js, D3.js
- Backend: Node.js, Python (with frameworks like Flask or Django), Go
- Cloud Platforms: AWS, Azure, Google Cloud Platform
- Databases: PostgreSQL, MongoDB, InfluxDB
- Communication Protocols: MQTT, CoAP, WebSockets
Additional Tips
- Choose the Right Visualization: Different types of visualizations are suitable for different types of data. Line charts are great for showing trends over time, bar charts for comparisons, and scatter plots for correlations.
- Real-Time Updates: For monitoring live data, consider using real-time visualization technologies like WebSockets.
- Customization and Interactivity: Allow users to customize the view, filter data, and drill down into specific details for more comprehensive analysis.
By harnessing the power of web applications for visualizing IoT data, businesses can gain a deeper understanding of their operations, optimize processes, and make data-driven decisions that lead to improved efficiency and growth.
Key Takeaways
- Web apps make it simple to visualize IoT data.
- Setting up involves configuring your IoT hub and deploying the web app.
- Dashboards offer clear and actionable insights.
Setting Up the IoT Data Pipeline
Setting up an IoT data pipeline involves creating an IoT Hub, registering devices, managing data flow, and deploying a web application for data visualization. Learn how to efficiently get started with each step.
Creating the IoT Hub on Azure
An Azure IoT Hub is the central point for all IoT devices.
- Azure Subscription: Ensure you have an active Azure subscription.
- Resource Group: Create a resource group in your desired location.
- IoT Hub: Use the Azure Portal or Azure CLI to create a new IoT Hub. The hub name must be unique globally.
- Configuration: Select the desired pricing and scale options.
These initial steps ensure you have a functional hub ready to communicate with your devices.
Registering Devices and Managing Data Flow
Once the IoT Hub is set, the next step is to register your devices and manage data flow.
- Device Registration: Add new devices to the IoT Hub via the Azure Portal. Each device gets a unique connection string for secure communication.
- Telemetry Messages: Devices send telemetry data to the IoT Hub. Ensure each device is configured to send real-time sensor data.
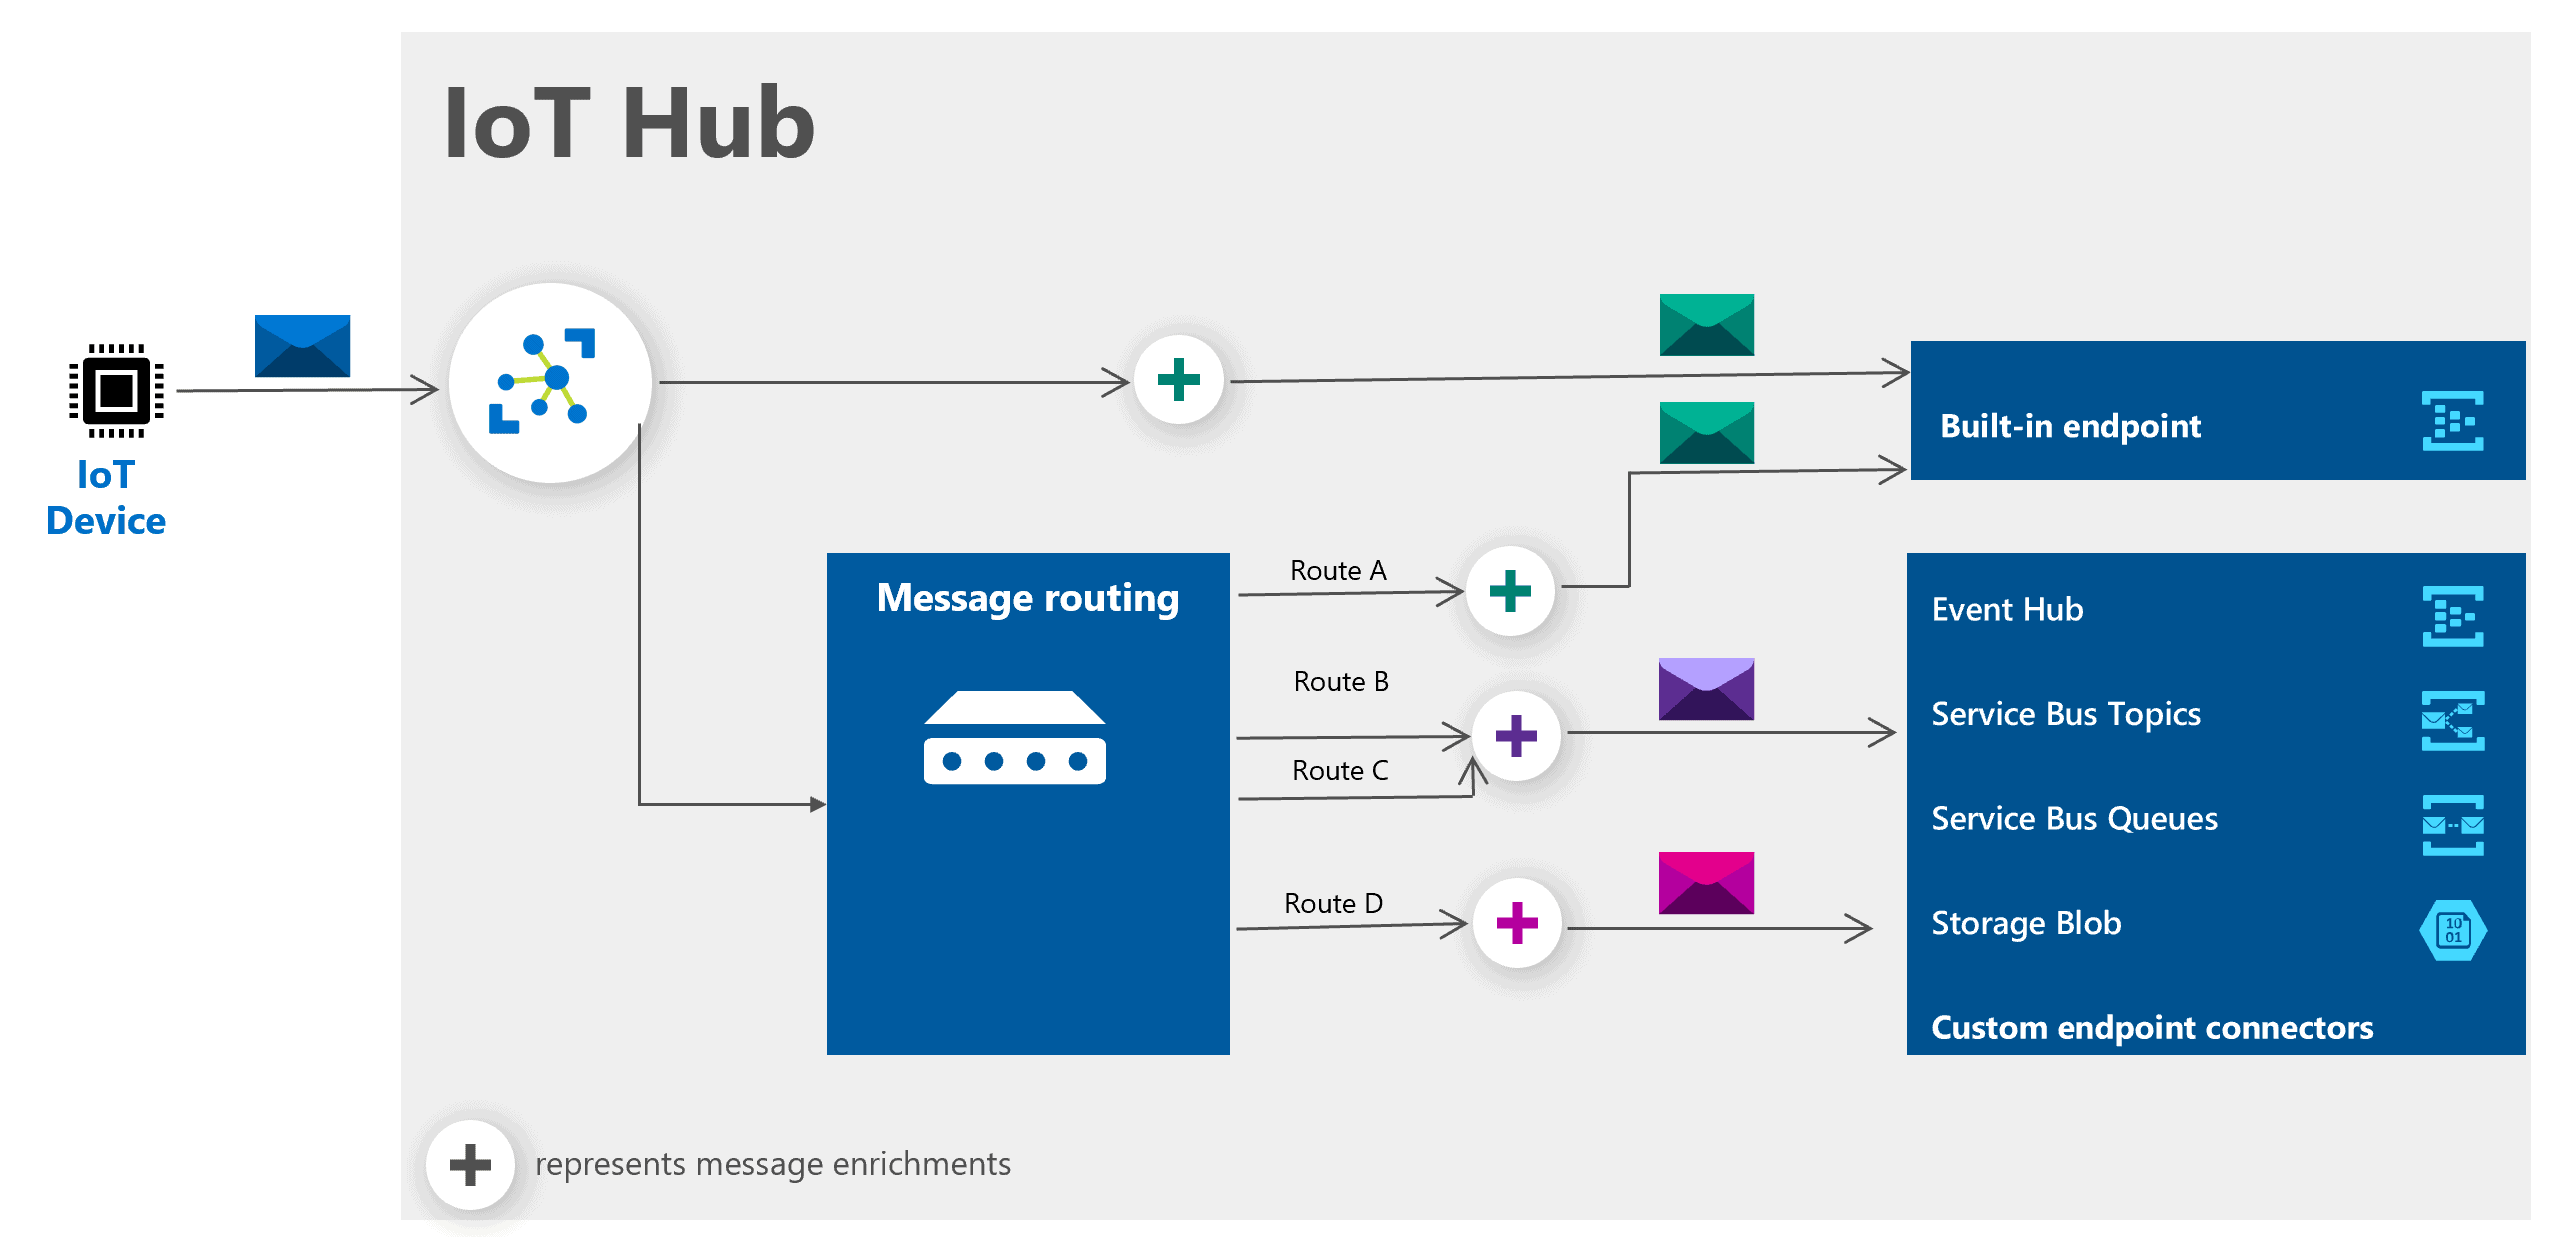
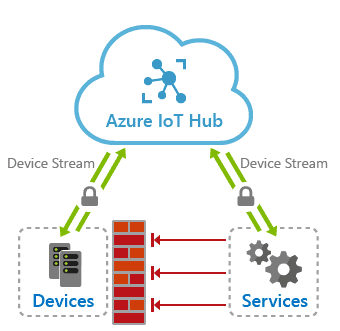
- Consumer Groups: Add consumer groups to read data from the IoT Hub’s built-in endpoint. These groups allow multiple services to process the same data stream independently.
Security is vital here; ensure encrypted communication using the provided connection strings.
Deploying the Web Application
Deploying the web application lets you visualize IoT data in real-time.
- Sample Code: Download a sample web app for IoT data visualization from GitHub or another source.
- Azure App Service: Deploy the app to Azure App Service for easy scaling and management.
- Configuration: Configure your web app to connect to the IoT Hub using the hub’s connection string. Ensure it reads telemetry data from your consumer groups.
- Visualization: Set up the web app to display real-time charts and graphs of the data. This can use WebSocket for live updates.
Deploying a web app provides a visual interface to monitor your device telemetry.
Setting up the IoT data pipeline involves coordinated steps that connect devices to a central hub and visualize data in a web app, providing a complete solution for monitoring and managing IoT devices.
Frequently Asked Questions
This section addresses common inquiries about integrating IoT data into web applications for visualization. It also covers best practices, technologies, and steps required for effective IoT data visualization.
How can one integrate IoT data into a web application for visualization purposes?
To integrate IoT data into a web app, start by collecting data from IoT devices using sensors. Then, use communication protocols like MQTT or HTTP to send this data to a server. Finally, visualize the data using web technologies like JavaScript and libraries like D3.js or Chart.js.
What are some best practices for designing web-based dashboards for IoT data analysis?
Design clean and intuitive interfaces. Use real-time data updates to ensure information is current. Employ visual elements like graphs and charts to simplify complex data. Also, optimize for different devices, ensuring a responsive layout.
Which technologies are commonly used for developing IoT data visualization on web applications?
JavaScript libraries such as D3.js, Chart.js, and Three.js are popular for creating visualizations. Frameworks like React and Angular can help build user interfaces. For backend services, Node.js and Express are commonly used, along with databases like MongoDB or SQL for data storage.
Can you provide examples of web applications that effectively visualize IoT data?
Microsoft Azure IoT Hub provides tools for analyzing and visualizing IoT data. The web app sample from GitHub includes code examples for data visualization. Another example is Intellisoft’s guide on creating web dashboards for IoT devices, which involves visualizing data through graphs and charts.
What are the steps involved in connecting an IoT device to a web application for real-time data visualization?
First, set up the IoT device and ensure it can send data. Next, configure a server to receive this data via protocols like MQTT. Store this data in a database. Use a web application framework to fetch the data and update visual elements like charts or graphs in real time.
How can one manage and interpret large volumes of IoT data through web app interfaces?
Use data aggregation to simplify large datasets. Implement filtering to focus on relevant information. Employ visual tools like heatmaps and dashboards to represent data trends clearly. Ensure the backend is capable of handling large data volumes to maintain performance.